Ho Chi Minh City Population: Updated Statistics 2025
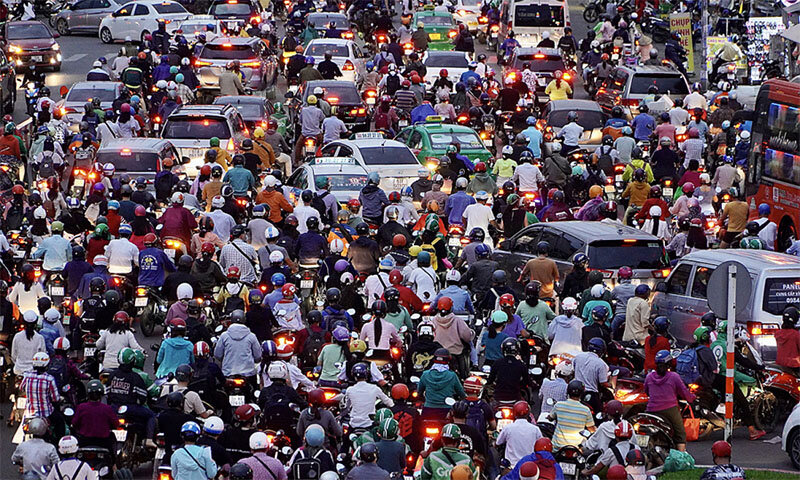
Ho Chi Minh City serves as the leading economic, cultural, educational, healthcare and scientific center of the country. With its remarkable growth rate, the population of Ho Chi Minh City has been continuously increasing in recent years, particularly as residents from various regions migrate here to settle and build their careers. According to the latest statistics for the first half of 2023, the population of Ho Chi Minh City reached nearly 9 million, making it the most populous city in the country.
Table of Contents
1. How many people are there in Ho Chi Minh City?
According to statistics as of June 1, 2023, the population of Ho Chi Minh City is nearly 8.9 million people (specifically 8,899,866 people). However, if we count those who reside without household registration, the actual population of the city reaches nearly 14 million people.
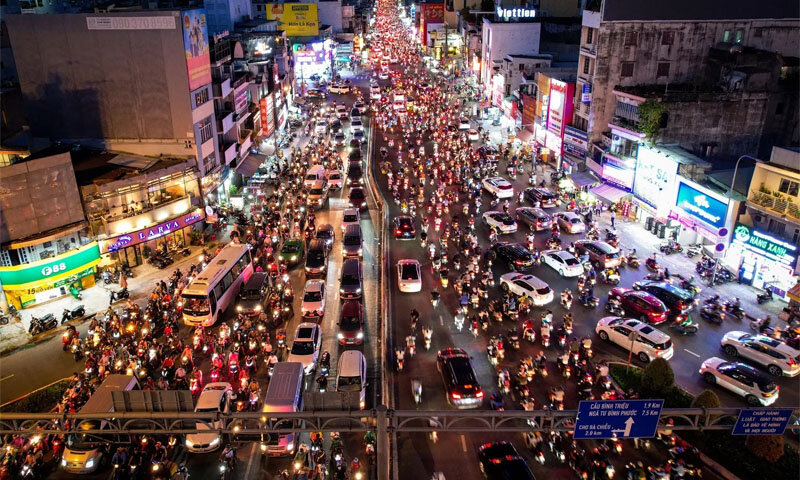
During the French colonial period, the population of Saigon was only about 20,000 – 30,000 people. By the year 2000, the population of Ho Chi Minh City had exceeded 5 million people, increasing about 3.2 times compared to the previous figure of 2.5 million people in old Saigon in 1975. Currently, Ho Chi Minh City is the largest city in the country in terms of population, accounting for about 8.9% of Vietnam’s population.
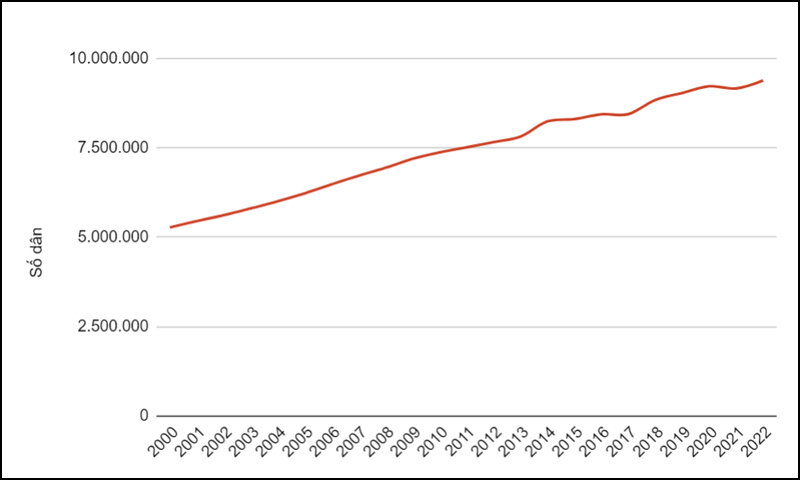
To see the rapid increase in population of Ho Chi Minh City, let’s follow the population change table below:
| Year | Population (people) | Increase/decrease ratio |
| 2000 | 5.274.900 | +4,0% |
| 2001 | 5.454.000 | +3,4% |
| 2002 | 5.619.400 | +3,0% |
| 2003 | 5.809.100 | +3,4% |
| 2004 | 6.007.600 | +3,4% |
| 2005 | 6.230.900 | +3,7% |
| 2006 | 6.483.100 | +4,0% |
| 2007 | 6.725.300 | +3,7% |
| 2008 | 6.946.100 | +3,3% |
| 2009 | 7.196.100 | +3,6% |
| 2010 | 7.378.000 | +2,5% |
| 2011 | 7.517.900 | +1,9% |
| 2012 | 7.663.800 | +1,9% |
| 2013 | 7.818.200 | +2,0% |
| 2014 | 8.244.400 | +5,5% |
| 2015 | 8.307.900 | +0,8% |
| 2016 | 8.441.902 | +1,6% |
| 2017 | 8.446.000 | +0,0% |
| 2018 | 8.843.200 | +4,7% |
| 2019 | 9.038.600 | +2,2% |
| 2020 | 9.227.600 | +2,1% |
| 2021 | 9.166.800 | −0,7% |
| 2022 | 9.389.700 | +2,4% |
2. The latest updated population density of Ho Chi Minh City
With a total population of nearly 8.9 million people and an area of 2,095 km², the estimated population density of Ho Chi Minh City reaches 4,375 people/km². As a result, Ho Chi Minh City currently has the highest population density in the country.
The distribution of residents in the city is somewhat uneven. While urban districts such as District 4, District 10 and District 11 have population densities exceeding 40,000 people/km², the suburban district of Can Gio has a much lower density of only 102 people/km².
In recent years, the population of central districts has shown a gradual decline. This trend is attributed to residents moving from the city center to newly established districts in the outskirts. Additionally, a significant number of immigrants from various provinces also choose to settle in the suburban districts due to their affordable living costs.
3. Population of Saigon divided by area
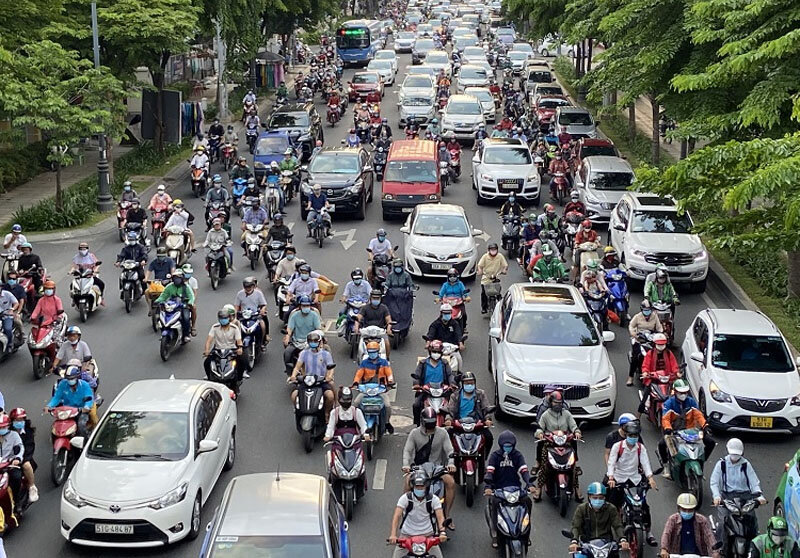
The population of Ho Chi Minh City is divided into two areas: urban and rural areas. According to the Statistical Yearbook 2022, Ho Chi Minh City has a total population of 9,389,700 people. Among them, the urban population reaches nearly 7,297,900 people, accounting for about 77.7% of the city’s total population. The rural population is 2,091,900 people, accounting for about 22.3% of the city’s total population.
The disparity in population between these two areas reflects the transition from an agricultural economy to an industrial economy and urbanization of Ho Chi Minh City.
4. Population structure of Ho Chi Minh City nowadays
The population structure of Ho Chi Minh City is divided based on various criteria, including age, gender, labor force, occupation, etc.
4.1. Population structure by labor force
Ho Chi Minh City is known as the “industrial capital” of Vietnam, housing numerous large-scale factories, enterprises and industrial parks, making it a leading hub in the country. This factor significantly attracts a large workforce from various regions to live and work here.
According to the 2022 Statistical Yearbook, the number of people in the working-age population in Ho Chi Minh City is approximately 4.6 million, accounting for about 49% of the city’s total population. Among them, around 4.5 million people are employed. Additionally, individuals who are beyond the working age but still participate in the labor force further contribute to the city’s increasing workforce size.
4.2. Population structure by age and gender
The total population of Ho Chi Minh City as of June 1, 2023, is nearly 8.9 million people (specifically 8,899,866 people). Among them, the population structure is divided by age groups as follows:
| Age group | Population (people) | Ratio |
| Under 5 years old | 541.613 | 6,1% |
| From 5 to 11 years old | 830.175 | 9,3% |
| From 12 to 17 years old | 735.773 | 8,3% |
| From 18 to 49 years old | 4.881.971 | 54,9% |
| From 50 to 65 years old | 1.368.311 | 15,4% |
| Over 65 years old | 542.821 | 6,1% |
According to the report from the Ho Chi Minh City Population and Family Planning Department in 2022, the average life expectancy of the city’s residents is 76.2 years, higher than the national average of 73.6 years. However, although life expectancy has increased, the average healthy life expectancy is only 64 years.
Currently, Ho Chi Minh City is facing the challenge of an aging population along with a low birth rate. Specifically, in 2022, the city’s total fertility rate was 1.39 children per woman, with a crude birth rate of 13.6%. Thus, Ho Chi Minh City is one of the provinces with a low birth rate in the country.
Regarding the gender structure of the population in Ho Chi Minh City, the male population is 4,510,400 people, while the female population is 4,656,400 people. The city’s gender ratio is also among the lowest in Vietnam, with a ratio of 94.4 males per 100 females in 2022. This means that for every 100 females, there are approximately 94.4 males.
4.3. Population structure by occupation
The population structure of Ho Chi Minh City is also divided by occupation, specifically into three main sectors:
- Sector I (Agriculture-Forestry-Fishery): The labor force in this sector has rapidly decreased from 13.9% in 1989 to 6.2% in 2002. Workers in this group are gradually transitioning to newer industries in sectors II and III.
- Sector II (Industry-Construction): The labor force in this sector accounts for approximately 41.3% of the city’s total population. This sector has a high labor force participation rate compared to Sector I and includes important industries such as textiles, food processing, electronics, mechanics and construction.
- Sector III (Services): Currently, the service sector is experiencing strong growth not only in Ho Chi Minh City but also in many other provinces and cities. As of 2021, approximately 51.9% of the labor force was employed in the service sector, making a significant contribution to the city’s GDP. Major service industries include commerce, tourism, finance, banking and real estate.
-
The proportion of workers in the service sector accounts for 51.9%
5. Population and population density of districts in Ho Chi Minh City
Understanding the population and population density of Ho Chi Minh City districts not only helps understand population distribution but is also an important factor for urban management and socio-economic development of the city. city. Below is a table summarizing data on population and population density of districts in Ho Chi Minh City:
| Number | Administrative units | Population (people) | Area (km2) | Number of wards and communes |
| 1 | District 1 | 142.625 | 7,73 | 10 wards |
| 2 | District 3 | 190.375 | 4,92 | 12 wards |
| 3 | District 4 | 175.329 | 4,18 | 13 wards |
| 4 | District 5 | 159.073 | 4,27 | 14 wards |
| 5 | District 6 | 233.561 | 7,14 | 14 wards |
| 6 | District 7 | 360.155 | 35,69 | 10 wards |
| 7 | District 8 | 424.667 | 19,11 | 16 wards |
| 8 | District 10 | 234.819 | 5,72 | 14 wards |
| 9 | District 11 | 209.867 | 5,14 | 16 wards |
| 10 | District 12 | 620.146 | 52,02 | 11 wards |
| 11 | Binh Thanh District | 499.164 | 20,78 | 20 wards |
| 12 | Go Vap District | 676.899 | 19,73 | 16 wards |
| 13 | Phu Nhuan District | 163.961 | 4,88 | 13 wards |
| 14 | Tan Binh District | 474.792 | 22,43 | 15 wards |
| 15 | Tan Phu District | 485.348 | 15,97 | 11 wards |
| 16 | Binh Tan District | 784.173 | 52,02 | 10 wards |
| 17 | Thu Duc City | 1.169.967 | 211,56 | 34 wards |
| 18 | Nha Be District | 206.837 | 100,43 | 1 town, 15 communes |
| 19 | Hoc Mon District | 542.243 | 109,17 | 1 town, 11 communes |
| 20 | Binh Chanh District | 705.508 | 252,56 | 1 town, 15 communes |
| 21 | Cu Chi District | 462.047 | 434,77 | 1 town, 20 communes |
| 22 | Can Gio District | 71.526 | 704,45 | 1 town, 6 communes |
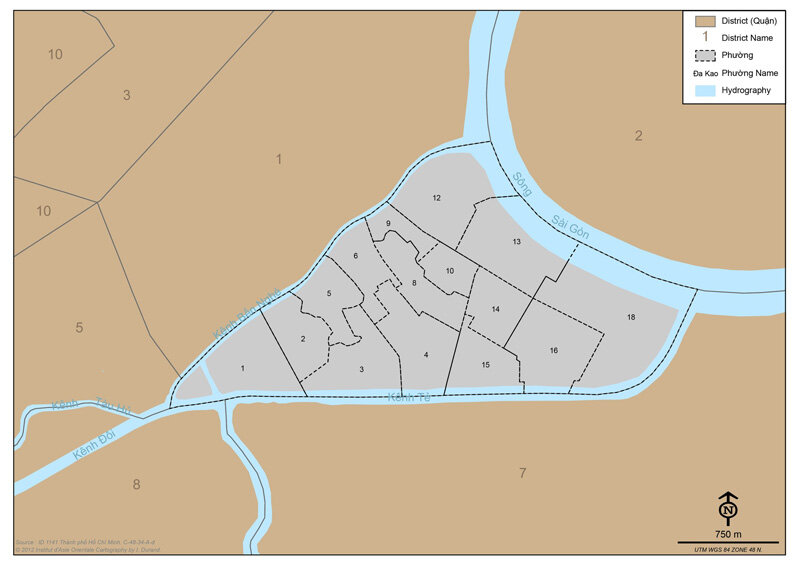
Among the 16 urban districts of Ho Chi Minh City, District 4 has the highest population density with 41,945 people/km2. As for the suburban districts, the highest population density is only 4,967 people/km2 (in Hoc Mon district), while the lowest is 102 people/km2 (in Can Gio district). Binh Chanh district currently has two communes with the highest total population in the area, namely Vinh Loc A commune (164,488 people) and Vinh Loc B commune (140,226 people). Following them is Binh Hung Hoa A commune, located in Binh Tan district, with 124,805 people.
Understanding the current population of Ho Chi Minh City is an important initial step in urban management. From the population structure, population density, development trends, the city government can formulate appropriate policies to build Ho Chi Minh City into a more sustainable and developed metropolis.


